
The mirDNMR database (https://www.wzgenomics.cn/mirdnmr) was mainly developed for browsing and searching background de novo mutation rates (DNMRs) as well as searching variant allele frequencies in human genetic variation databases for each gene. Meanwhile, another two convenient tools were also provided in mirDNMR. One for prioritizing candidate disease-causal genes based on de novo mutations (DNMs) detected from trio-based WGS/WES data. The other for filtering interested genes based on the range of background DNMRs and the distribution of different variant types in human genetic variation databases. Gene function enrichment analysis supplied by mirDNMR could also be used to assist with candidate disease-causal DNM and gene identifications. Details about the database data, the data input and analysis results for different functionalities are described bellow.
Background DNMRs were predicted by four methods: GC content (DNMR-GC), sequence context (DNMR-SC), multiple factors (DNMR-MF) and local DNA methylation level (DNM-DM). It is of note that DNMR for three different mutation types of loss-of-function (LoF, including stop-gain, stop-loss, splicing site destructions and frame-shift INDELs), missense (Mis), and synonymous (Syn) predicted by DNMR-SC, DNMR-MF, and DNMR-DM were collected by mirDNMR. It is also noted that average DNMR of the four background DNMRs (DNMR-average) was also incorporated in the mirDNMR database. Detail information for the four methods is described as below:
Genetic variants within gene regions are obtained from five main human genetic variation databases including ExAC (r0.3.1), ESP6500 (ESP6500SI-V2), UK10K, the 1000 Genomes (Phase 3) and dbSNP (Build 147). The variant frequency for each genetic variant refer to that of the whole population rather than any specific sub-populations. Mutation effect for each mutations or population genetic variants were inferred based on the RefSeq gene mode using the ANNOVAR software.
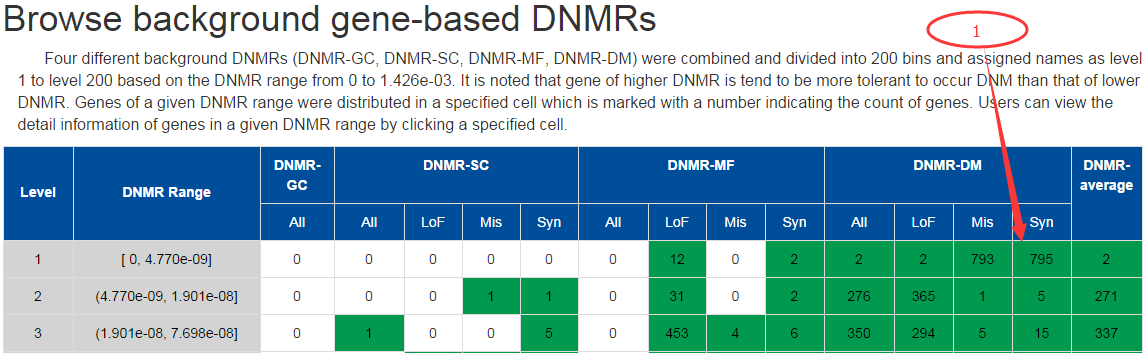
In this page, user could browser all genes (20,523 RefSeq genes) according to their background DNMR ranges predicted by 4 different methods (DNMR-GC, DNMR-SC, DNMR-MF, DNMR-DM) and also for different mutation types (LoF, Mis, and Syn) individually on one big table.
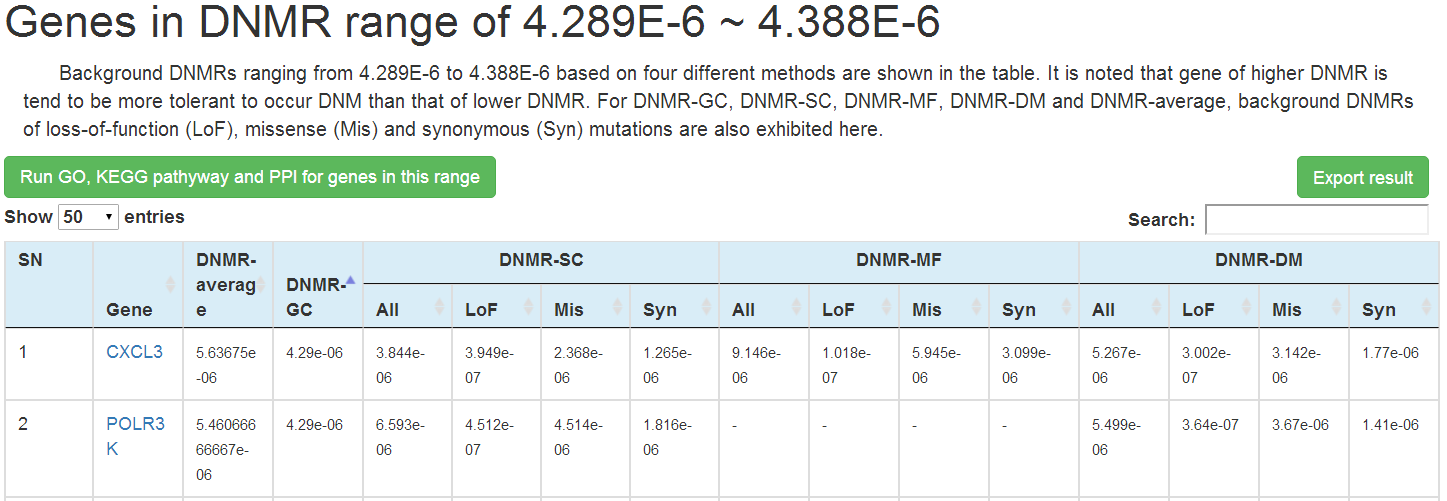
In the table, all human genes were split into 200 bins according to predicted background DNMR ranges (0 ~ 1.426e-03) and ordered from lower to higher with 'Level' on the first column to represent the order. Each row corresponds to one background DNMR range and each column corresponds to one prediction method and mutation type used. The number of genes within each DNMR range for each method or mutation types are shown in the corresponding cells of the table. The background color for the cell is set as green if more than 1 gene found in the specific DNMR range, or white for 0.
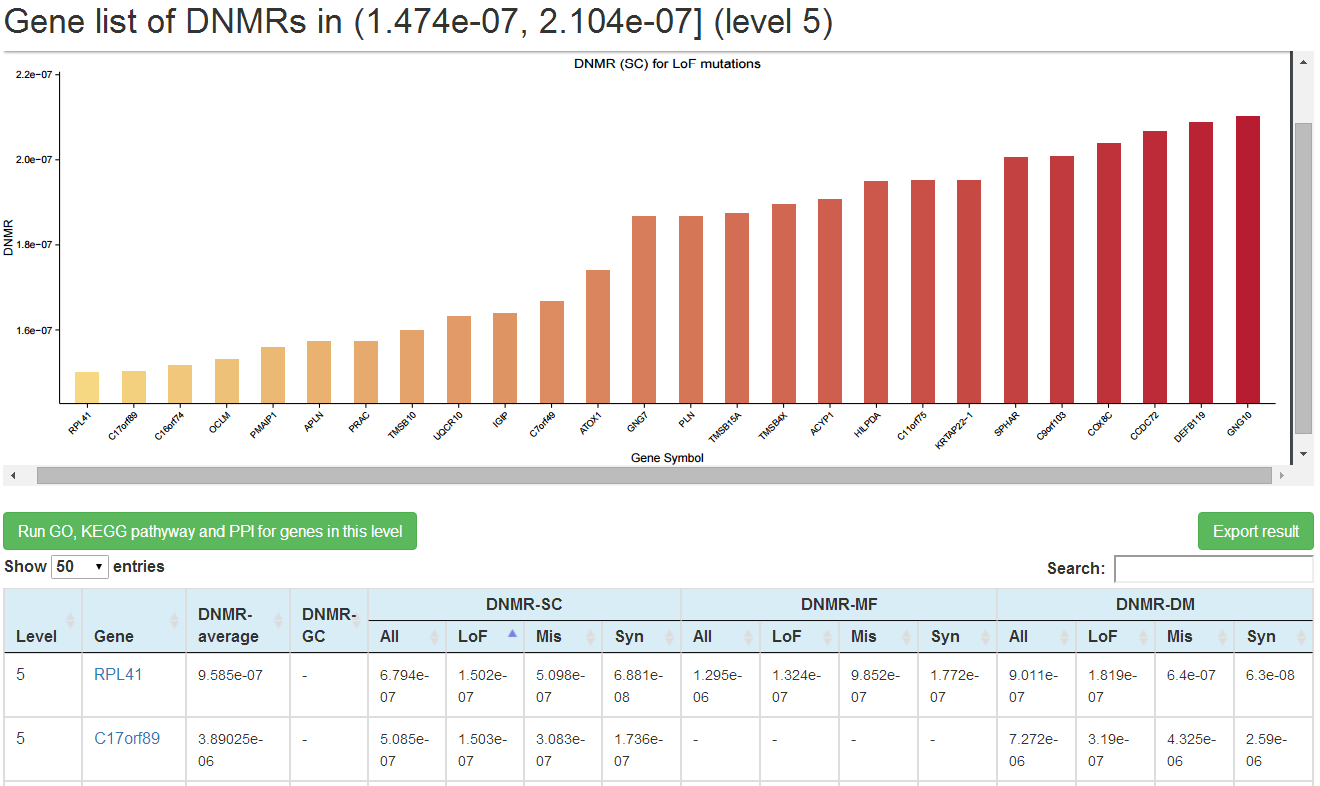
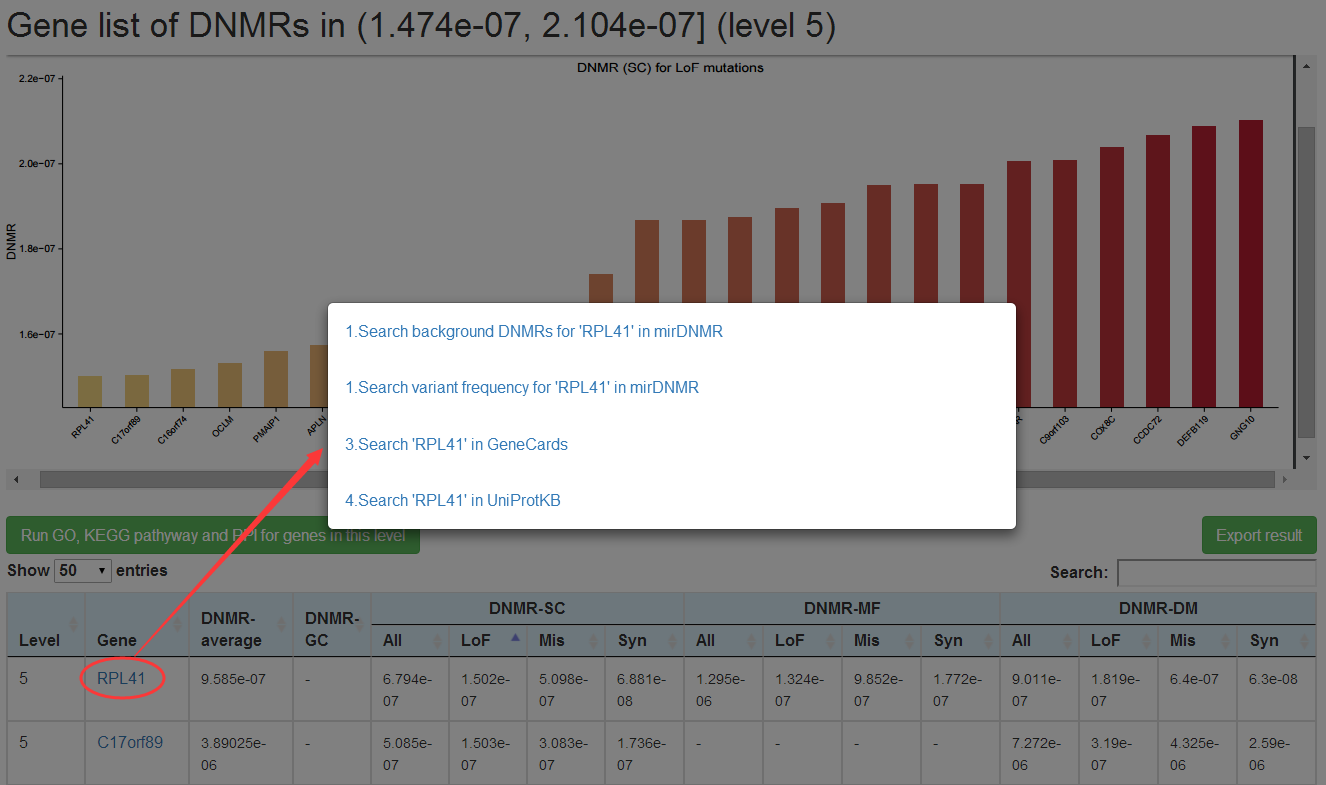
Genes within each DNMR range for each method could be visualized in detail on new web page by clicking on the number (1) in the corresponding cell. In the new page, a plot on the upper part is presented to show background DNMRs for each gene predicted by the specific method in the case of >=5 genes, and table on the lower part to list background DNMRs predicted by the 4 methods for all genes within this DNMR range. User could choose to search the mirDNMR, GeneCards (http://www.genecards.org/) or UniProtKB (http://www.uniprot.org/help/uniprotkb) databases for more information about the gene by clicking on the gene name on the table. The table could be downloaded by clicking on the 'Export result' button on the top-right corner of the table.
Background DNMRs and variant allele frequencies in human genetic variation databases are searchable for each gene or genomic region in mirDNMR.

Users could search for background DNMRs for a given gene or all genes within specific DNMR range. By input of a given gene (HGNC-approve gene symbol only), the background DNMR predicted by 4 different methods (All) and different mutation types individually(LoF, Mis, Syn) are shown in the result page. By selecting background DNMR prediction method and inputting a given DNMR range, a table of background DNMRs for all genes within this DNMR range are shown in the result page. Meanwhile, a button named "Run GO, KEGG pathway and PPI for all genes in this range" was provided in this page, users can get functional enrichment result for all genes in given DNMR range conveniently (see Function enrichment analysis part bellow for details). User could choose to search the mirDNMR, GeneCards (http://www.genecards.org/) or UniProtKB (http://www.uniprot.org/help/uniprotkb) databases for more information about the gene by clicking on the gene name on the table.

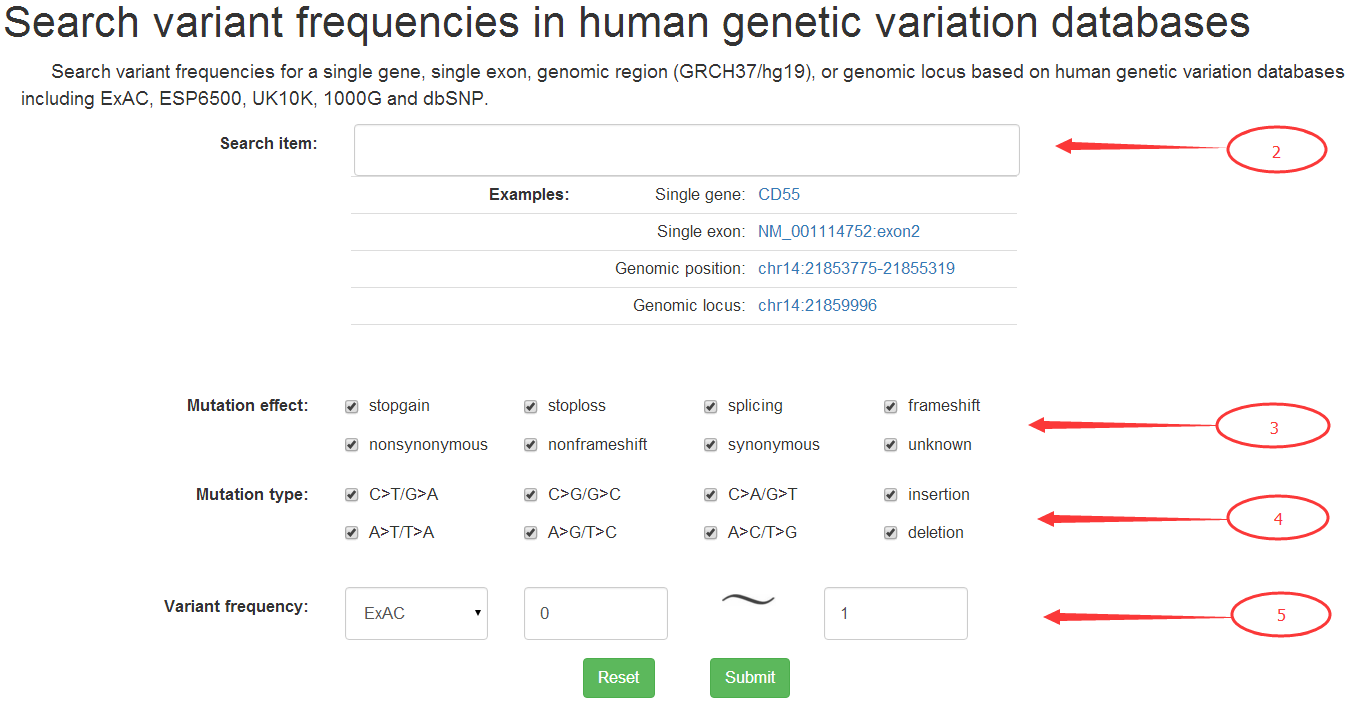
Users could conveniently obtain genetic variants from human population variation databases for a specific gene, exon, genomic region or genomic locus.
The HGNC approved gene symbol, transcript ID with exon number (Refseq gene model), and genomic coordinate (GRCH37/hg19) in the form of 'chromosome:start-end' for a genomic region or 'chromosome:position' for a genomic locus is acceptable as input (2). The genetic variants presented could be filtered according to their mutation effects (3), base change types (4), and range of variant allele frequencies in the four human genetic variation databases (5).
mirDNMR provides the following information for a gene:
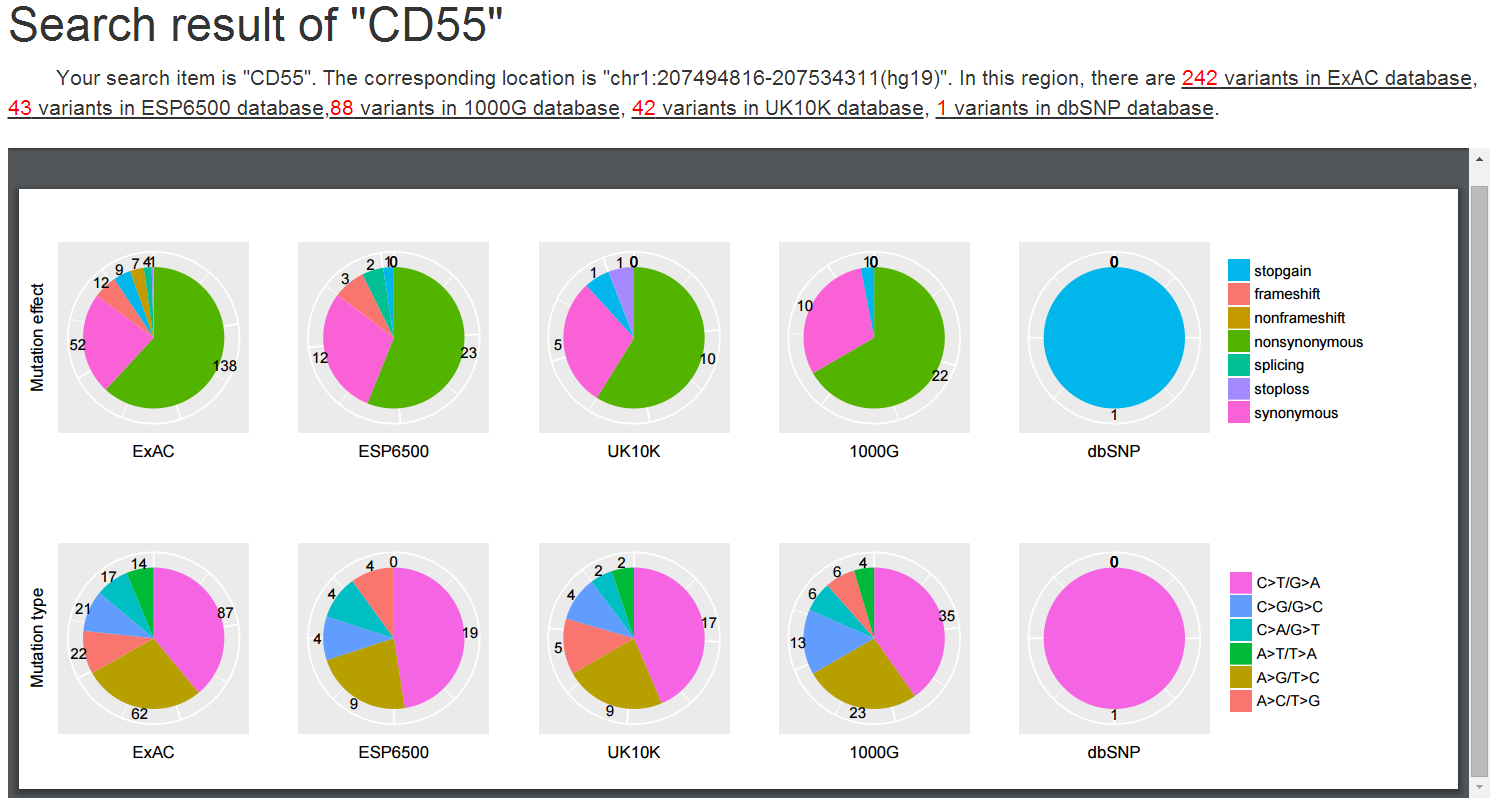
In the population variation summary, counts of variants from different transcript isoform of the gene from 5 population variation databases are shown.
On the table of population variants, annotation information for each variant including the mutation effect, amino acid change, cytoband, dbSNP id and variant frequencies in the population variation databases (ExAC, ESP6500, UK10K and 1000 Genomes) are shown.
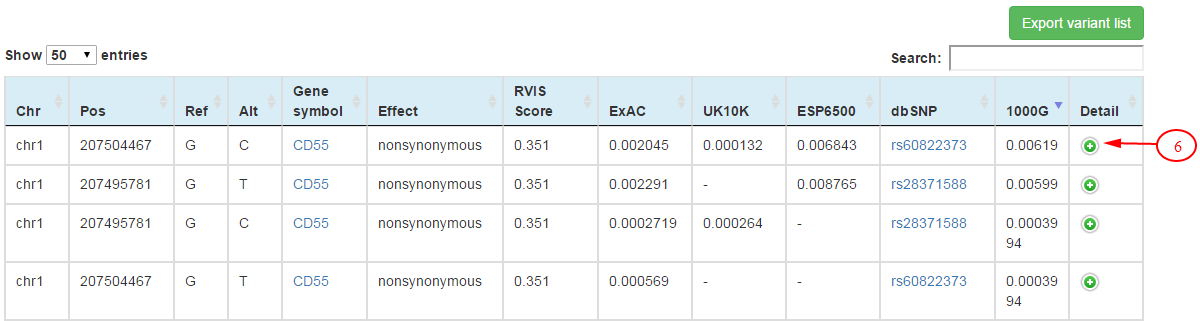
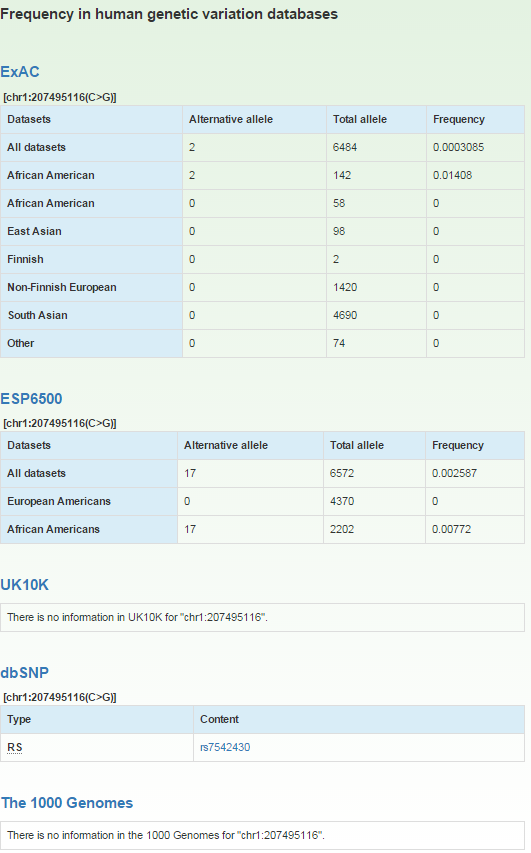
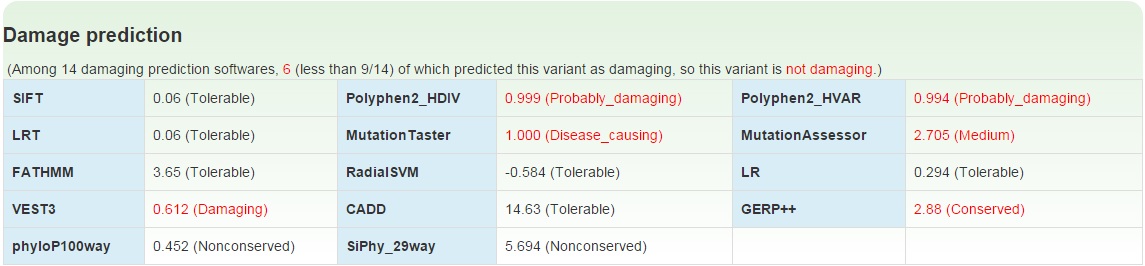
Further annotation data including allele frequencies and allele counts in sub-population of population variation databases and damaging effect predictions for missense variants by 14 computational methods could be obtained by clicking on the '+' on the 'Detail' column (6) for each variant.
We take 14 computational methods to predict whether a missense variant is damaging or not. Values of the 14 methods are given as follows. Only the missense variant being predicted as damaging by equal or more than 9 methods will be considered as a damaging missense variant.
| Method | Damaging | Tolerant |
| SIFT | Damaging | Tolerable |
| Polyphen2_HDIV | Possibly_damaging; Probably_damaging | Benign |
| Polyphen2_HVAR | Possibly_damaging; Probably_damaging | Benign |
| LRT | Deleterious | Neutral; Unknown |
| MutationTaster | Disease_causing_automatic; Disease_causing | Polymorphism; Polymorphism_automatic |
| MutationAssessor | High; Medium | Low; Neutral |
| FATHMM | Damaging | Tolerable |
| RadialSVM | Damaging | Tolerable |
| MetaLR | Damaging | Tolerable |
| VEST3 | Damaging | Tolerable |
| CADD | Damaging | Tolerable |
| GERP++ | Conserved | Nonconserved |
| phyloP100way | Conserved | Nonconserved |
| SiPhy_29way | Conserved | Nonconserved |
The transcript ID with exon number (Refseq gene model) should be supplied as input, such as "NM_001114752:exon2". The search result for each exon input is similar to that of a gene, but only variants from within the exon will be shown. Please refer to descriptions of the population genetic variants on the "Search results for a gene" part for details.
The genomic region (GRCH37/hg19) defined as 'chromosome:start-end' should be supplied as input, such as "chr14:21853775-21855319". The search result for a genomic region is similar to that of gene, but only variants from within the genomic region will be shown. Please refer to descriptions of the population genetic variants on 'Search results for a gene' part for details.
For the input of a genomic locus (GRCH37/hg19), only the one table containing variant(s) of the locus along with annotation data is presented. Please refer to descriptions of the population variants table on 'Search results for a gene' part for details.
This functionality was developed to prioritize candidate genes based on elevation of DNMR observed from sequencing data for each gene by comparison to the background DNMR predicted.
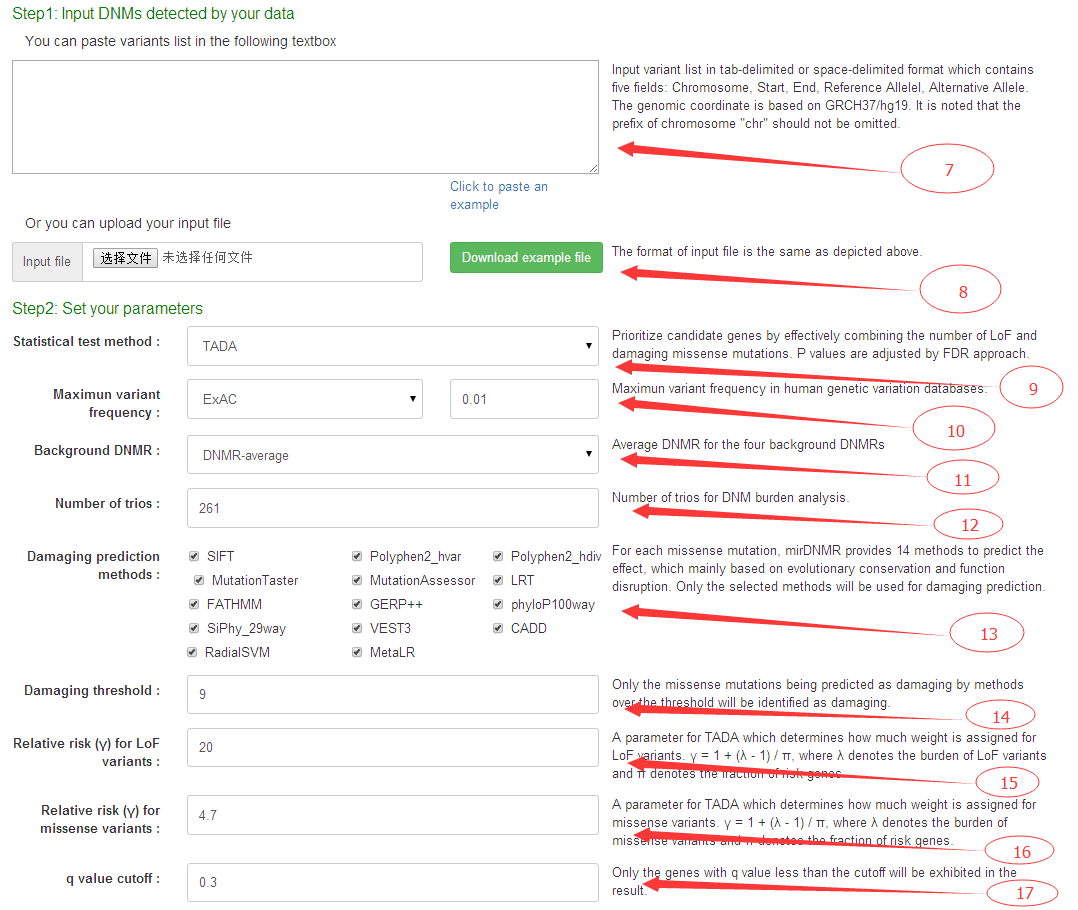
For data input, user should paste list of DNMs (7) or upload a file in ".txt" format (8) containing DNMs detected. The DNMs for input should be defined in the format of 'chromosome, start, end, reference base, alternate base' that is separated by tabs or spaces.
For parameter definition, users could select statistic test methods for prioritization (TADA, Exact Binomial Test, or Exact Poisson Test, more information about the methods described below) (9), any of the 5 background DNMR prediction methods (DNMR-average, DNMR-GC, DNMR-SC, DNMR-MF, DNMR-DM) (11), the number of trios used for user-input DNMs detections (12), the p value adjust methods (or False Discovery Rate (FDR) estimations) and q value cutoff (17) for filtering.
In addition, if the TADA prioritization method is used, user need to define the mutation effect prediction methods(13) and the minimum number of methods with damaging predictions (14) to decide whether one missense variant is damaging or not, which is required for TADA prioritizations. We also added two parameters to determine the relative risk for LoF and missense variants for the TADA program. The parameter which determines how much weight is assigned for LoF variants. γ = 1 + (λ - 1) / π, where λ denotes the burden of LoF variants and π denotes the fraction of risk genes(15). The parameter which determines how much weight is assigned for missense variants. γ = 1 + (λ - 1) / π, where λ denotes the burden of missense variants and π denotes the fraction of risk genes(16).
For the prioritization methods, the TADA refer to the published TADA method (Transmission And De novo Association Test) by Xin He et al. Briefly, The TADA method uses a Bayesian model that effectively combines de novo LoF and de novo damaging missense variants, and prioritize candidate genes based on background DNMRs. Exact Binomial Test was implemented using a R function "binom.test(x, n, p, alternative='greater')" where "x" refers to number of de novo mutations in case, "n" refers to "(number of trios) * 2", "p" refers to background DNMR which could be freely specified by users. Exact Poisson Test was implemented using a R function "poisson.test(x, n, p, alternative='greater')" where "x", "n", "p" of the function are the same as those of Exact Binomial Test.
After about 20 seconds processing, the gene prioritization results is presented as one table with one gene each row. For each gene, the gene name, RVIS score (gene mutation tolerance), number of trios used for DNM detections, number of DNMs detected in the gene from user-input, observed DNMR, background DNMR predicted, ratio between observed vs predicted DNMR, the statistic test p value and adjusted p value are shown. The smaller p value and adjusted p value means more significance of DNMR elevation in user-input data than background DNMR predicted.
User could choose to search the mirDNMR, GeneCards (http://www.genecards.org/) or UniProtKB (http://www.uniprot.org/help/uniprotkb) databases for more information about the gene by clicking on the gene name on the table.
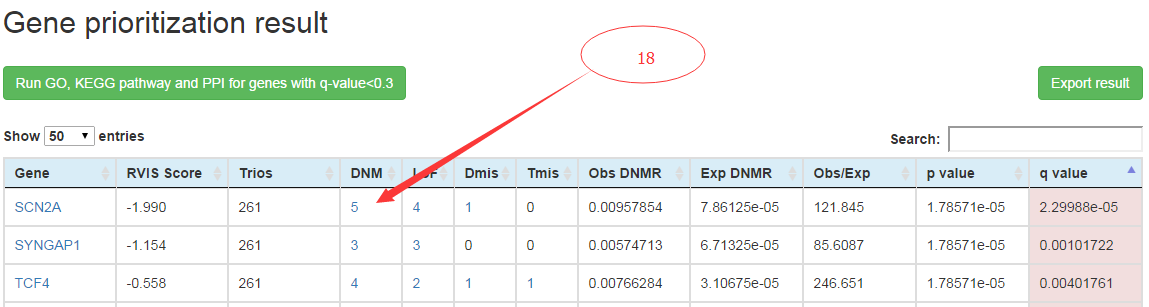
In the result table produced using TADA statistic method, the number of DNMs detected include that of total DNMs, LoF DNMs (include stop-gain, stop-loss, splicing site destructions and frame-shift INDELs predicted on RefSeq gene model by ANNOVAR software), damaging missense DNMs (predicted as damaging by more than certain number of prediction methods specified by user) and tolerant missense DNMs (the rest missense DNMs except damaging missense DNMs).
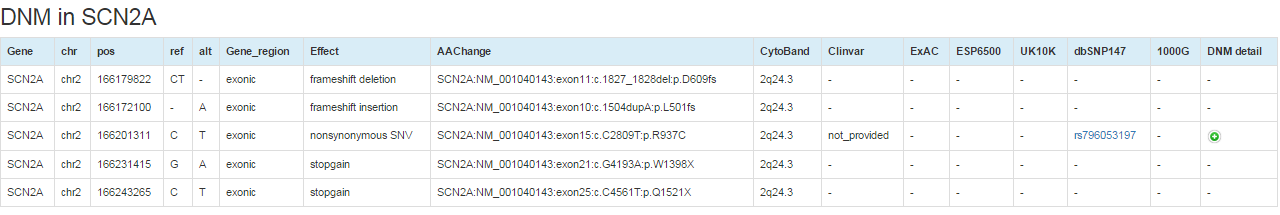
Details about the DNMs detected for the gene could be visualized on new page by clicking on the corresponding numbers on the prioritization result table (18). Detail annotations for the DNMs including genomic coordinates, base changes, mutation consequences on the transcript, cytoband, clinvar database ID, variant allele frequency in human population variation databases, and dbSNP id are shown. Further detail information of the DNM including variant allele counts in sub-populations and mutation damaging effect predictions could be obtained by click on the '+' of 'DNM detail' column.
For the prioritization result, users can run functional enrichment analysis by clicking the button "Run GO, KEGG pathway and PPI for genes with q<0.3".
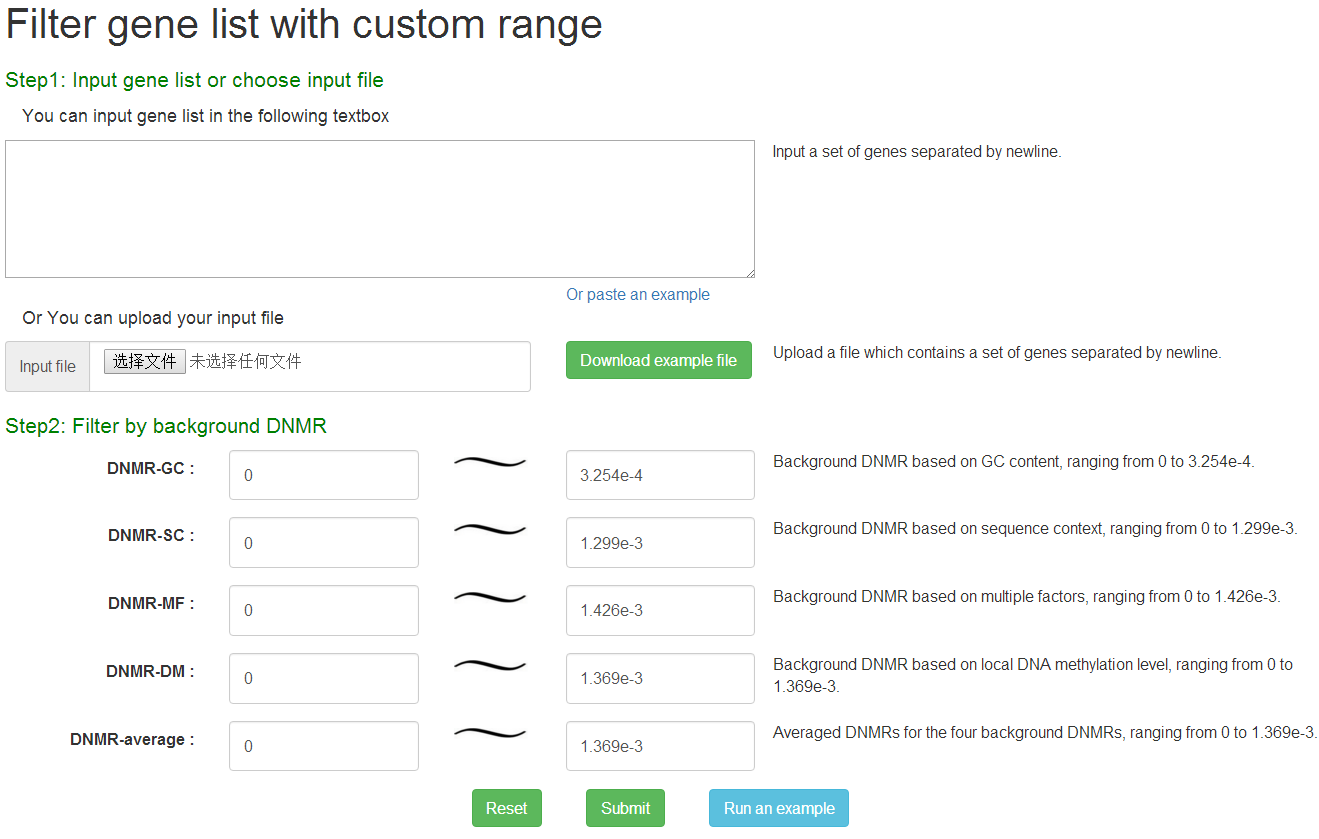
User could filter out genes from input gene list according to its background DNMRs by 4 different prediction methods. At first step, the HGNC-approved gene symbols should be directly filled into the box or uploaded as txt file with one each line as input. Then, the background DNMR ranges should be defined for different prediction methods separately for gene filtering.
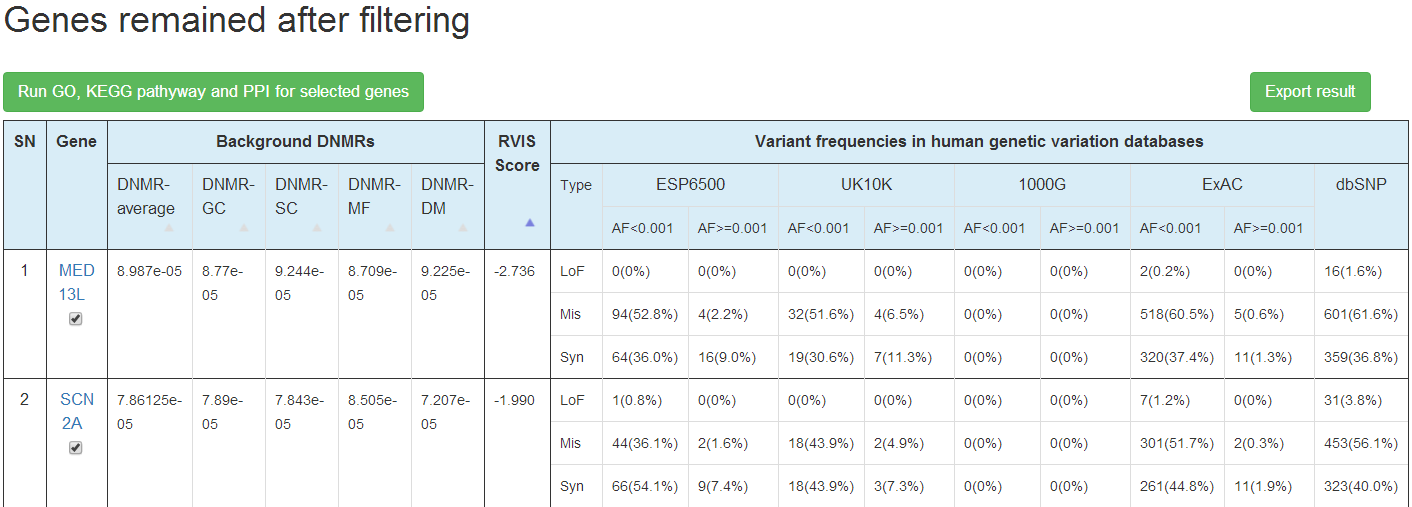
In the result, the genes passed the DNMR filtering are presented on one table with background DNMRs predicted by 4 methods, RVIS score and population genetic variants information from 5 population variation databases shown. For the population variations for each gene, counts and proportion of variants from different allele frequency level (AF<0.001 or >0.001) and mutation effect (LoF, Mis, Syn) are shown. User could choose to search the mirDNMR, GeneCards (http://www.genecards.org/) or UniProtKB (http://www.uniprot.org/help/uniprotkb) databases for more information about the gene by clicking on the gene name on the table.
The whole table could be downloaded by click on the 'Export result' button.
Users can run functional enrichment analysis by clicking the button "Run GO, KEGG pathway and PPI selected genes" on the top-left corner.
To reveal the underlying functions for a gene set, GO, KEGG pathway and protein-protein interaction enrichment analysis could be performed by clicking on "Run GO, KEGG pathway and PPI selected genes" button on the result page of "Browse", "Search", "Prioritize" and "Filter" functionalities. Gene annotations of GO terms and KEGG pathways are originate from "org.Hs.eg.db" package. The GO terms and KEGG pathway enrichment are performed using a bioconductor package named "GOstats" under R environment, by which the hypergeometric test is used for enrichment test and the resultant p values are adjusted by FDR approach. For the protein-protein interaction analysis, the protein interactions between two tested genes retrieved based on BioGRID database (Version 3.4.138) will be shown.
It will take about 1 minute to produce the results presented on a new web page with three tabs to show GO, KEGG pathway enrichment and protein-protein interaction analysis results, separately.
(a) For the GO terms enrichment analysis result, three tables are shown for biological process, molecular function and cellular component. For each table, one GO term is shown on each row, and the columns from left to right correspond to index number, GO term, GO term description, expected number of genes in the GO term, observed number of genes in the GO term, odds ratio, total number of genes in the GO term, p value calculated by hypergeometric test, adjusted p value by FDR approach (q value), related genes.
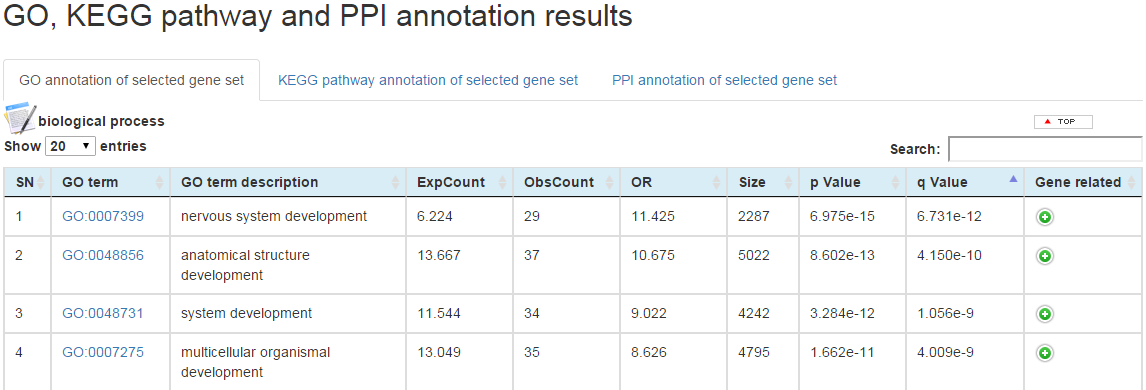
User could be directed to the AmiGo database (http://amigo.geneontology.org/amigo/) by clicking on the GO term on the table for detail information, and to the GeneCards database (http://www.genecards.org/) by clicking on the gene names on the table for detail annotation information.
(b) For the KEGG pathway enrichment analysis results table, one KEGG pathway is shown on each row, and the columns from left to right correspond to index number, KEGG pathway tag, descriptions, expected number of genes in the pathway, observed number of genes in the pathway, odds ratio, total number of genes in the pathway, p value calculated by hypergeometric test, adjusted p value calculated by FDR approach (q value), related genes.

User could see details of the specific KEGG pathway by clicking on the KEGG pathway tag, and to the GeneCards database (http://www.genecards.org/) by clicking on the gene names on the table for detailed annotation information for the gene.
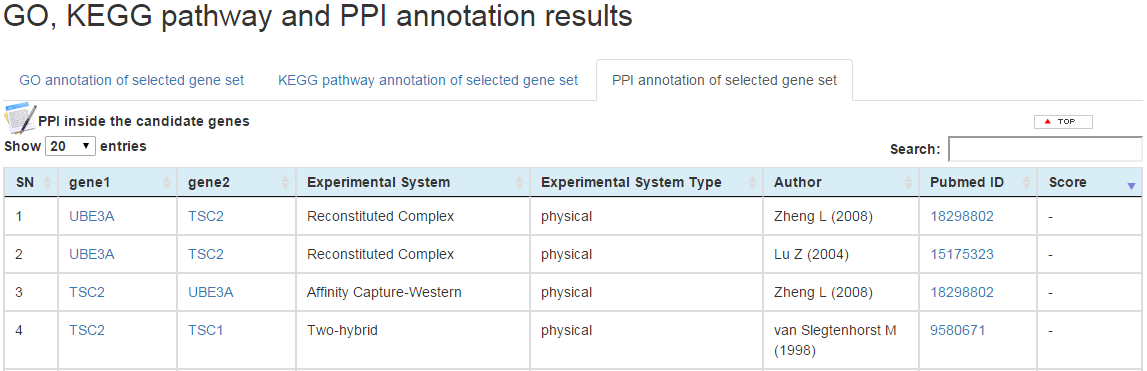
(c) PPI network is based on BioGRID database (3.4.138). For the PPI analysis results table, two tables are shown for genes inside the candidate genes and genes outside the candidate genes. For each table, one interaction is shown in each row, and the column from left to right correspond to index number, gene 1, gene 2, experimental system, experiment system type, author, pubmed id, and interaction score.
In this web page, DNMRs predicted for all human genes are supplied for downloading as txt file, in which the gene symbols is on the first column and DNMR on the second column.
